
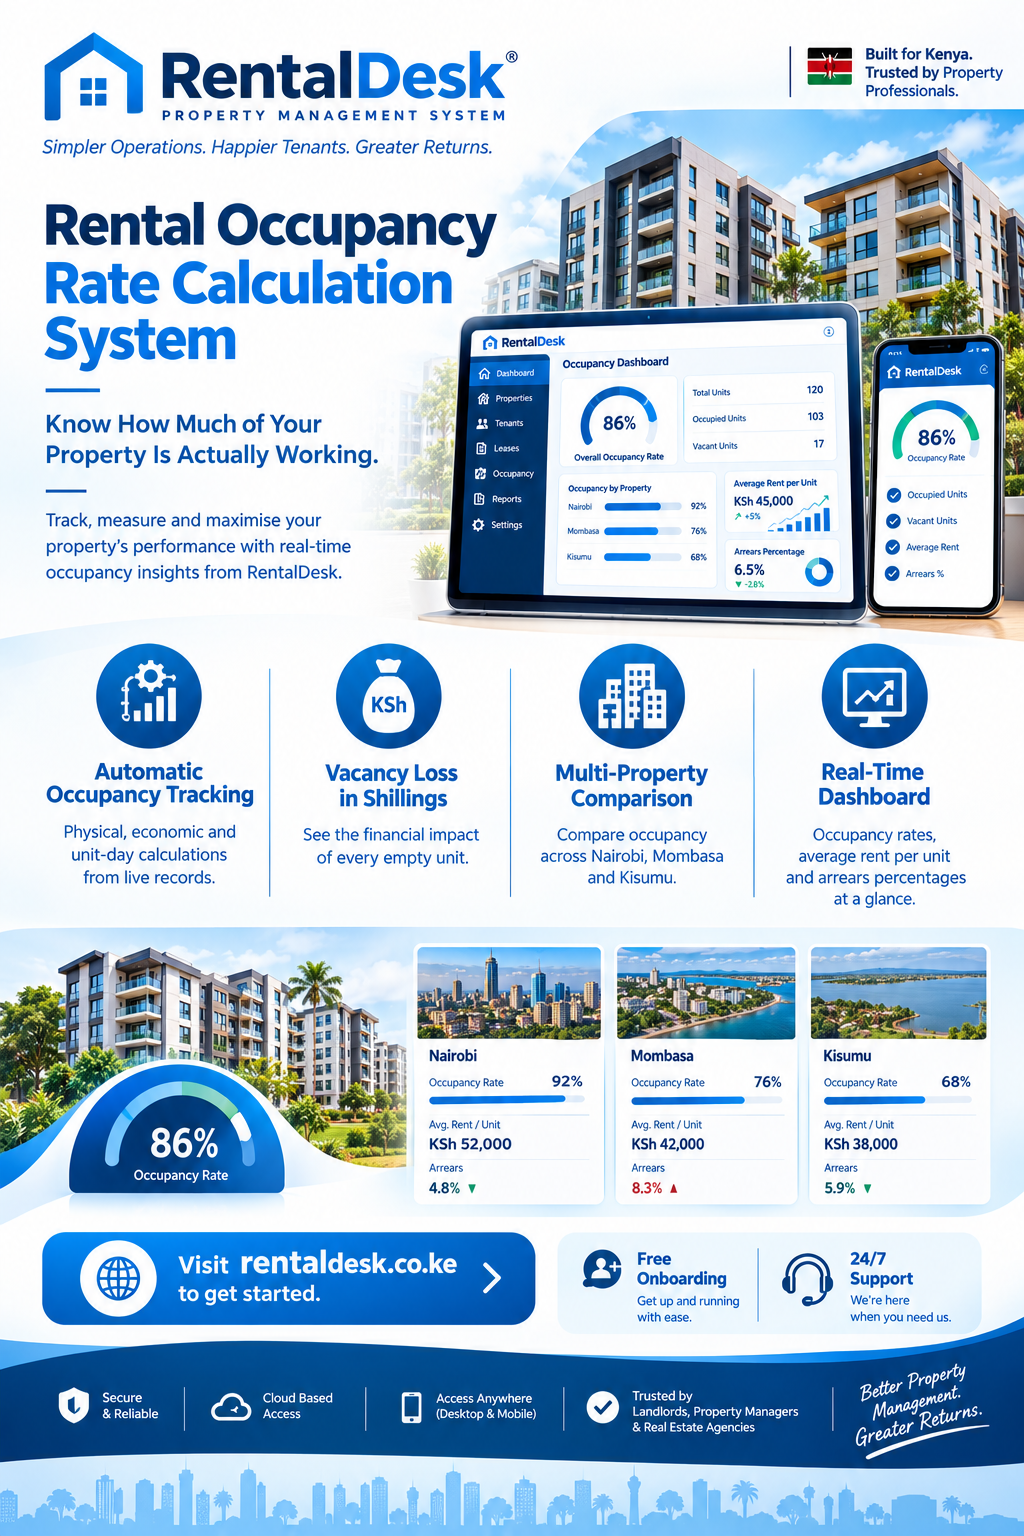
Rental occupancy rate calculation system is the metric that tells a landlord whether the portfolio is actually working, and it is the metric most Kenyan landlords calculate wrongly or not at all. Most owners track rent collected. Very few track the percentage of units that were occupied and paying during the period, which is the figure that explains why the rent collected was what it was.
A landlord who collected KSh 400,000 last month from ten units feels successful until someone asks how many of those ten units were occupied for the full month. If only seven were, the collection rate is 70%, and the gap between what was possible and what was achieved is the vacancy loss. A rental occupancy rate calculation system turns that gap into a number the landlord can manage.
Why Occupancy Rate Matters More Than Rent Collected
The rental occupancy rate calculation system conversation begins with a distinction that Kenyan property managers often blur. Rent collected tells you what arrived. Occupancy rate tells you what proportion of the property was available to generate rent in the first place. The two are related but not identical, and the difference is where money is lost.
Consider a landlord with eight units paying KSh 25,000 each. The theoretical gross rent is KSh 200,000 per month. If six units are occupied and two are vacant, the landlord collects KSh 150,000 — a 75% occupancy rate. If the landlord only tracks the KSh 150,000, the vacancy loss of KSh 50,000 per month, or KSh 600,000 per year, remains invisible. The rental occupancy rate calculation system exists to make that loss visible before it compounds.
Industry benchmarks illustrate why this matters. Cytonn’s Q1’2026 residential apartments summary recorded an average occupancy rate of 83%, with average total returns to apartment investors at 7.8%, a 0.2 percentage point decrease from the 8.0% recorded in Q1’2025. Commercial office occupancy improved by 2.7 percentage points to 84.7% in Q3’2026 from 82.4% in Q3’2025. Nairobi’s prime office occupancy rate rose by 4.05% to 84.88% in the six months to June 2026. Retail occupancy in the Nairobi Metropolitan Area rose to over 90.0% in 2024 from 70.0% in 2020. A landlord whose residential portfolio sits at 65% occupancy is not just below average — they are losing a substantial share of the return their investment should be generating.
The Basic Occupancy Rate Formula
The rental occupancy rate calculation system rests on a formula that is simple in principle and frequently mishandled in practice. The standard formula is:
Occupancy Rate = (Number of Occupied Units ÷ Total Number of Units) × 100
If a landlord has 20 units and 17 are occupied, the occupancy rate is 85%. If a property manager reports on a portfolio of 120 units across three buildings, and 96 are occupied, the portfolio occupancy rate is 80%.
The formula is straightforward, but the inputs require discipline. Total number of units must be the rentable units, not the total physical spaces. A caretaker’s store, a guardhouse, or a manager’s office is not a rentable unit and should not be included in the denominator. If it is included, the occupancy rate is understated and the landlord draws the wrong conclusion about performance.
Similarly, the number of occupied units must reflect units that are genuinely occupied under a lease and generating rent. A unit that is occupied by a relative rent-free, or a unit that is under renovation, is not producing rent and should be classified separately rather than counted as occupied. A rental occupancy rate calculation system that treats all non-vacant units as occupied will overstate performance and hide revenue leakage.
Physical Occupancy vs Economic Occupancy
The rental occupancy rate calculation system conversation must distinguish between two versions of the metric, because Kenyan landlords frequently report one and manage the other.
Physical occupancy measures how many units are occupied, regardless of whether rent has been paid. A unit where the tenant has lived for three months without paying is physically occupied but economically vacant. The formula is the number of occupied units divided by total units.
Economic occupancy measures how much of the potential rent was actually collected. A common formulation is total rental income collected minus other income, divided by market rent. Another formulation calculates it as vacancy loss subtracted from market rent. The precise formula matters less than the principle: economic occupancy reflects the rent actually realised, not merely the presence of a tenant.
A landlord with 100% physical occupancy but three non-paying tenants may have an economic occupancy of 70%. A landlord with 85% physical occupancy and all paying tenants has an economic occupancy of 85%. The second landlord is performing better, but a rental occupancy rate calculation system that reports only physical occupancy will show the opposite.
A third variant, monthly actual occupancy percentage, is calculated as vacancy loss divided by market rent. This version is useful for monthly reporting because it captures partial-month vacancies — a unit that was occupied for twenty days of a thirty-day month was 66.7% occupied for that period, not 100%.
Any landlord building a rental occupancy rate calculation system should decide which variants they need and report them consistently. Mixing physical and economic occupancy across reports makes trend analysis impossible.
Unit-Days: The More Accurate Calculation
The rental occupancy rate calculation system becomes more accurate when it accounts for partial periods. A unit that was vacant for fifteen days in a thirty-day month was not fully occupied and not fully vacant. Treating it as either distorts the occupancy figure.
The unit-days method solves this. Multiply the number of units by the number of days in the period to get total available unit-days. Then count the actual occupied unit-days. Divide occupied unit-days by total available unit-days and multiply by 100.
For a property with ten units over a thirty-day month, total available unit-days are 300. If one unit was vacant for the full month and another was vacant for fifteen days, occupied unit-days are 300 minus 30 minus 15, which equals 255. The occupancy rate is 255 ÷ 300 × 100, or 85%.
This method is more precise than the simple unit count, and it matters when vacancies occur mid-month. A landlord who relies on month-end snapshots will report 100% occupancy if every unit happens to be occupied on the last day of the month, even if several units were vacant for most of it. A rental occupancy rate calculation system that uses unit-days captures the reality.
Vacancy Loss and Its Financial Impact
The rental occupancy rate calculation system conversation must translate occupancy into money, because the percentage alone does not motivate action.
Vacancy loss is the rent that could have been collected but was not because units were unoccupied. It is calculated by multiplying the number of vacant unit-days by the daily rent for the unit, or by multiplying the number of vacant unit-months by the monthly rent.
For a landlord with two units vacant for a full month at KSh 25,000 each, the vacancy loss is KSh 50,000. Over a year, if the same two units remain vacant, the loss is KSh 600,000. That figure is often larger than the management fee, the maintenance budget, or any other single operating cost. Yet it is the figure most landlords never calculate.
A rental occupancy rate calculation system should report vacancy loss alongside the occupancy percentage. The percentage tells the landlord there is a problem. The shilling figure tells the landlord how much the problem is costing.
How RentalDesk Tracks Occupancy
RentalDesk is built specifically for the Kenyan market, and occupancy tracking sits at the centre of the platform. The system maintains a live record of which units are occupied, which are vacant, and which are under maintenance, and it calculates occupancy rates automatically from that record.
RentalDesk allows landlords and property managers to monitor occupied and vacant units, rental rates, property availability, and occupancy trends in real time. The dashboard can be customised to visualise key metrics — occupancy rates, average rent per unit, and arrears percentages — at a glance. This means the landlord does not need to build a spreadsheet to calculate occupancy. The system calculates it from the same records used for rent collection and tenant management.
The platform also connects occupancy to revenue. A guide to tracking vacant units and rent revenue together explains how agencies can see occupancy, expected income, arrears, and unit performance in one system. This connection is what makes a rental occupancy rate calculation system useful rather than decorative. The occupancy rate is not an isolated statistic. It is the denominator that explains whether the rent collected represents good performance or poor performance.
Multi-Property Occupancy Analysis
The rental occupancy rate calculation system becomes more valuable when it works across a portfolio. A landlord with properties in Nairobi, Mombasa, and Kisumu needs to know which location is performing and which is dragging the average down.
RentalDesk supports multi-property management. The platform provides a unified dashboard where landlords can view all properties at a glance, track occupancy and vacancies per building, compare revenue performance, and analyse arrears per location. Properties can be grouped by region, allowing the landlord to see that a Nairobi block is at 92% occupancy while a Kisumu property is at 68%, and to investigate the difference.
This portfolio view matters because occupancy patterns vary significantly by market. Nairobi’s prime office occupancy stood at 84.88% in mid-2026. Airbnb occupancy in Nairobi was around 44%, Mombasa around 38%, and Kisumu around 22.5%. A landlord comparing a long-term residential property against a short-stay unit is comparing two different occupancy benchmarks, and a rental occupancy rate calculation system should allow the comparison without conflating the categories.
Occupancy and the Rental Yield Calculation
The rental occupancy rate calculation system conversation connects directly to rental yield, because occupancy is a component of the yield formula. The formula used in Kenyan property analysis is:
Rental Yield = (Monthly Rent per SQM × Occupancy Rate × (1 − Operational Cost %) × 12) ÷ Development Cost per SQM
This formula demonstrates why occupancy is not a secondary metric. It is a direct multiplier on yield. A property with an 8% yield at 90% occupancy would yield 7.1% at 80% occupancy, holding everything else constant. A landlord who improves occupancy from 70% to 85% improves yield by roughly 21%, without increasing rent or reducing costs.
Any landlord learning to calculate yield should learn to calculate occupancy first, because the second depends on the first. A rental occupancy rate calculation system that reports occupancy accurately gives the landlord the input needed for a credible yield calculation.
Common Occupancy Calculation Mistakes
The rental occupancy rate calculation system journey has predictable failure modes.
Including non-rentable units in the denominator. A caretaker’s store, a guardhouse, or a common area is not a rentable unit. Including it understates occupancy.
Counting non-paying tenants as occupied. A unit where the tenant has not paid for three months is physically occupied but economically vacant. Treating it as occupied overstates performance.
Using month-end snapshots instead of unit-days. A unit that was vacant for twenty-five days but occupied on the last day of the month will appear occupied in a snapshot. Unit-days capture the reality.
Failing to exclude units under renovation. A unit undergoing major repairs is not available to let and should be excluded from the denominator or reported separately, not counted as vacant and dragging down the rate.
Mixing residential and short-stay occupancy. Long-term residential occupancy benchmarks differ from Airbnb occupancy benchmarks. Comparing them without adjustment produces misleading conclusions.
Not connecting occupancy to revenue. An occupancy rate without a vacancy loss figure is a statistic without a consequence. The landlord needs both.
Improving Occupancy: What the Number Tells You to Do
The rental occupancy rate calculation system is only useful if it drives action. A low occupancy rate can have several causes, and each requires a different response.
If units are vacant because they are priced above market, the answer is a rent review informed by comparable listings. If units are vacant because they are in poor condition, the answer is maintenance and refurbishment. If units are vacant because marketing is weak, the answer is better listing photography, wider distribution, and faster response to enquiries. If units are vacant because tenant screening is too strict, the answer is a review of the screening criteria — not their abandonment, but their calibration.
RentalDesk supports this analysis by connecting occupancy to unit performance. The landlord can see which units are consistently vacant, which are consistently occupied, and which have high turnover. That pattern is the starting point for a diagnostic conversation, and a rental occupancy rate calculation system that surfaces it is worth more than one that simply reports a portfolio-wide percentage.
How to Get Started
Implementing a rental occupancy rate calculation system is straightforward with RentalDesk .
Step 1: Sign up. Visit RentalDesk and create your account. Choose a plan that matches your portfolio size.
Step 2: Define your rentable units. Record every unit that can generate rent. Exclude stores, guardhouses, and common areas from the denominator.
Step 3: Classify unit status. Mark each unit as occupied, vacant, under maintenance, or otherwise unavailable. This classification drives the occupancy calculation.
Step 4: Record lease start and end dates. The system needs these dates to calculate unit-days and to identify upcoming vacancies before they occur.
Step 5: Configure occupancy reporting. Decide which occupancy variants you need — physical, economic, or unit-days — and confirm that the dashboard displays them.
Step 6: Review occupancy weekly. Do not wait for month-end. Weekly review catches vacancies while there is still time to act.
Step 7: Connect occupancy to revenue. Review vacancy loss alongside the occupancy rate so that the financial impact is visible.
The Future of Occupancy Analytics in Kenya
The rental occupancy rate calculation system landscape is moving toward real-time analytics. Kenyan rental markets are increasingly segmented, with prime office occupancy at 84.88%, commercial office occupancy at 84.7%, residential apartments averaging 83%, and retail exceeding 90%. Short-stay occupancy operates on a different scale entirely, with Nairobi around 44% and Kisumu around 22.5%. A landlord who knows the benchmark for their segment can judge whether their own occupancy is a problem or simply the market.
Cloud-based property management platforms are making this analysis available to small landlords, not just institutional investors. RentalDesk provides real-time dashboards, multi-property occupancy tracking, and vacancy insights in one platform. The landlord who adopts a structured rental occupancy rate calculation system early will know, every month, exactly how much of their property is working for them and how much is sitting empty.